Time calculation is maybe the most misunderstood concept in web analytics. You think you’ve got it right, but you maybe don’t. This is a very important topic already explained by Justin Cutroni in 2012 in his blog post Understanding Time on Site and Time on Page in Google Analytics.
In this blog post, I’ll explain how time calculation works in web analytics and how it’s changing depending on the tool you use.
How Web Analytics Tools (Used To) Calculate Time Spent On A Page
When you’re using a web analytics tool, you’re tracking the time visitors spent on a page or on your website. But how is this time calculated? It’s not as simple as you might think.
To get it right, I’m going to explain it step by step, starting with the easiest case.
Let’s take the example of a website that has only page views tracked and no event (no click, no scroll, etc.).
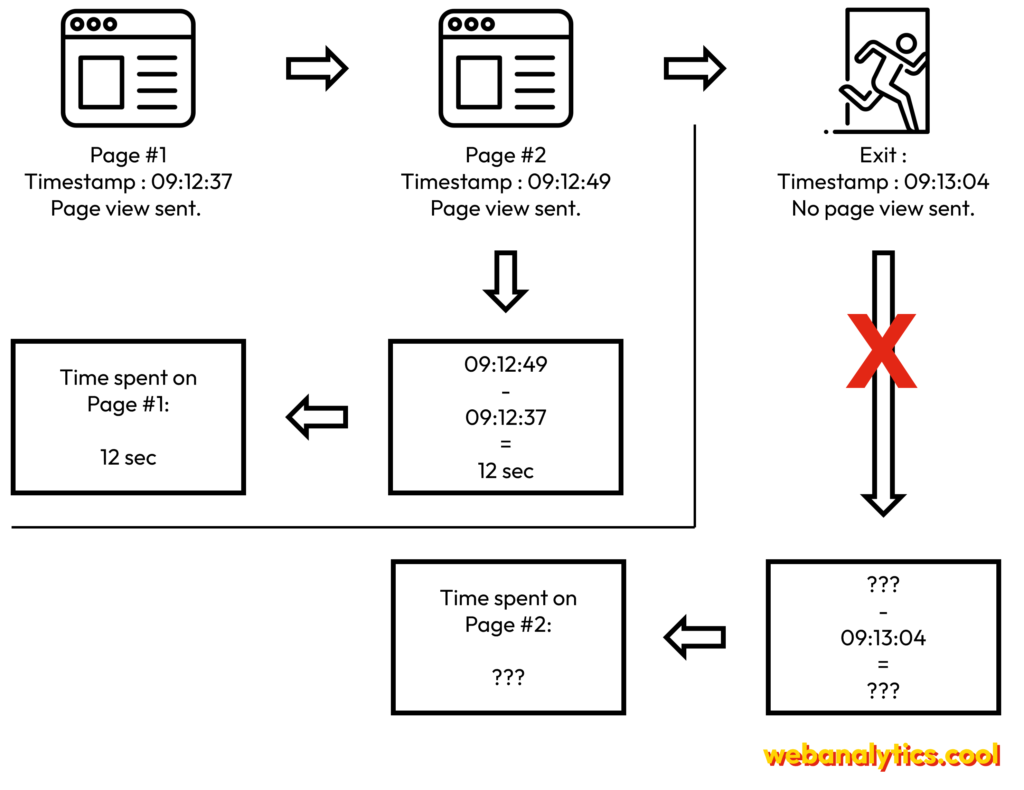
When you arrive on a website, a pageview hit is sent with the timestamp of the pageview.
If you leave immediately, most of the web analytics tools won’t be able to determine the time you’ve spent on this page because there is no other interaction.
Thus the “time on page” and “time on site” metrics will be equal to 0.
Now if you arrive on a page, the go to another page, a new pageview hit is sent with the timestamp of the new pageview.
One the server received the second pageview hit, it can calculate the time spent on the first page by subtracting the timestamp of the first pageview from the timestamp of the second pageview.
So the time you’ve is based on the time between the first and the second pageview, thus is only available because of the second pageview.
If you continue to navigate on the website, the same process will be repeated for each page.
Thus we cannot really have a good idea of the time spent on the last page of the visit because we don’t have the timestamp of the next pageview.
Now let’s take the example of a website that have pageviews and events tracked.
Let’s take the same example as before, but this time, we have events tracked on the website.
So you have visited the first and the second page, then after 10 seconds you clicked on a button and after 30 seconds you leave the page.
When you click on the button, an event hit is sent with the timestamp of the event.
So the estimation of the time spent on the second page is based on the time between the second pageview and the event hit.
Obliviously the time spent on the second page after the event hit is not taken into account.
But this is not as easy as it seems, because there are event with interaction and event without interaction.
Let’s detail how these events work:
- An event with interaction: when triggered, the timestamp of the event is sent to the server and it’s taked into account in the time spent on the page.
- An event without interaction: when triggered, the timestamp of the event is sent to the server but the it’s not taked into account in the time spent on the page.
What’s Changing In The Time Calculation?
The approach of time calculation described above was mainly right until the end of 2020.
But since October 2020, Google launched Google Analytics 4, a new version of Google Analytics, and things have changed.
Google is not the only one to change the way time is calculated, let’s review how time is calculated in the main web analytics tools.
Google Analytics 4
Since GA4, there is a new event in Google Analytics called “user_engagement” that is sent “periodically” to the server.
According to the official Google documentation, “this event is sent when the app is in the foreground or webpage is in focus for at least one second”.
It is not really clear how and when this event is sent.
Thus several analysts have tried to reverse engineer this event to complete Google documentation.
Root and Branch and Analytics Mania have written a blog post about this new event:
- Root and Branch: GA4 User Engagement: Understanding the User Engagement Metric
- Analytics Mania: Demystifying user_engagement Event in Google Analytics 4
It seems that this event is sent every 10 seconds when the user is active on the page.
Thus the time calculation is now based on this event and not on user active interaction.
This is a big change in the time calculation and it’s important to understand it to be able to interpret the time metrics in Google Analytics 4.
Piwik Pro
In Piwik Pro, there is a similar approach to Google Analytics 4 with a periodic event called “Heartbeat” that can be send periodically to the server.
However, there are two main differences with GA4.
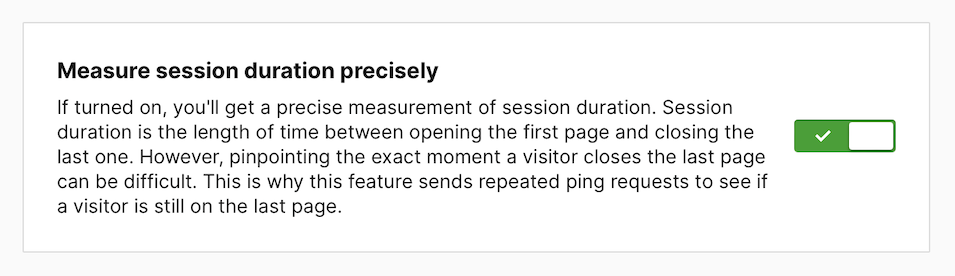
1. You can decide to activate or not this event in the TMS part of Piwik Pro
Because Piwik Pro free version is based on the number of hits received (500k per month), you can decide to activate or not this event to avoid to reach the limit of hits.
You just have to click on a switch in the TMS part of Piwik Pro to activate or not this event.
2. Piwik Pro well documented how this heartbeat ping works
This can be easily found in the official Piwik Pro documentation:
“Ping requests are sent with decreasing frequency. The first one is sent 15 seconds after the page loads. The last one 30 minutes later. The frequency in seconds goes like this: 15, 30, 60, 120, 240, 480, 960, 1800.”
Adobe Analytics, Piano Analytics & Matomo
Regarding Adobe Analytics, Piano Analytics and Matomo, it doesn’t seem that these tools have changed the way time is calculated.
Thus, when using these particular tools, the time calculation is still based on the user active interaction.
Conclusion
We usually don’t use time on page and time on site as major KPIs in digital marketing but they are very often present in dashboards and reports.
Understanding how time is calculated in web analytics tools is important to be able to interpret these metrics.
Basically, you can trust time calculation in Google Analytics 4 and Piwik Pro when the heartbeat ping is activated.
But you should be careful when using other web analytics tools because the time calculation is based on user active interaction and not on a periodic event.